Introduction
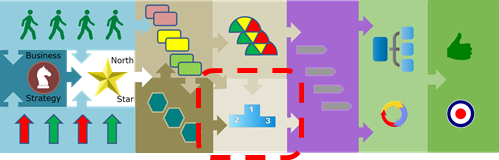
This is the tenth article in my Business Architecture Essentials series. In article nine I dealt with a fast way of comparing the strategic intent North Star of our vision, goals and objectives as the basis for a high level business process centric approach to prioritizing the highest gain and highest pain buckets of work to focus on. That approach typically works well for those just starting out or those wanting to conduct a quick filter of possibilities to be examined more deeply. In this article, I will provide a more sophisticated method to detail the challenge of picking the right problem to solve and to delve more deeply into the short list of possibilities provided by the fast track method shown in Article 9. If you have not read that article I recommend you do so to have the background thinking used here. All of the guidance of strategic intent, stakeholder analysis and performance gap will provide the same Pain and Gain criteria. I will just apply them more specifically and deeply here. The results will allow us to do confident process and project scoping and define the requirements for capability changes. We will still be in the same domain as article 9 as shown in Figure 1.
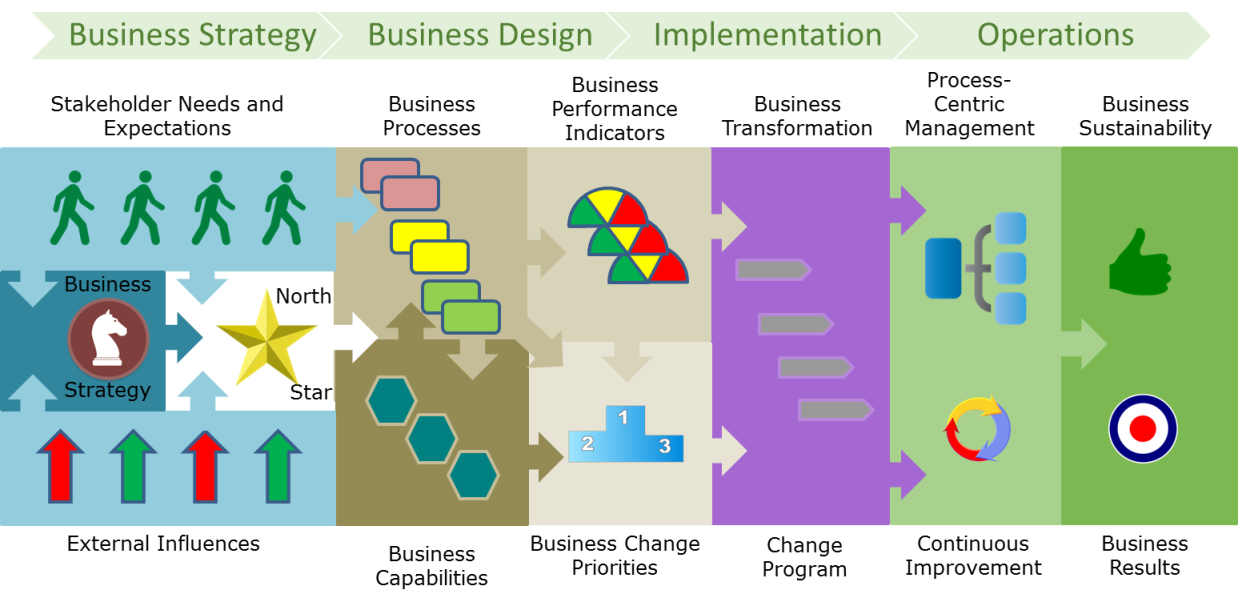
Figure 1
Once again we will use two main types of business knowledge. The first is aimed at understanding the drivers for business operations in terms of the business ecosystem, business intent and strategy as dictated by the world that the business is part of and our stakeholders in that world. The second is the current performance levels as compared to what we strive to attain by the time we reach our planning horizon.
Comprehensive Pain and Gain
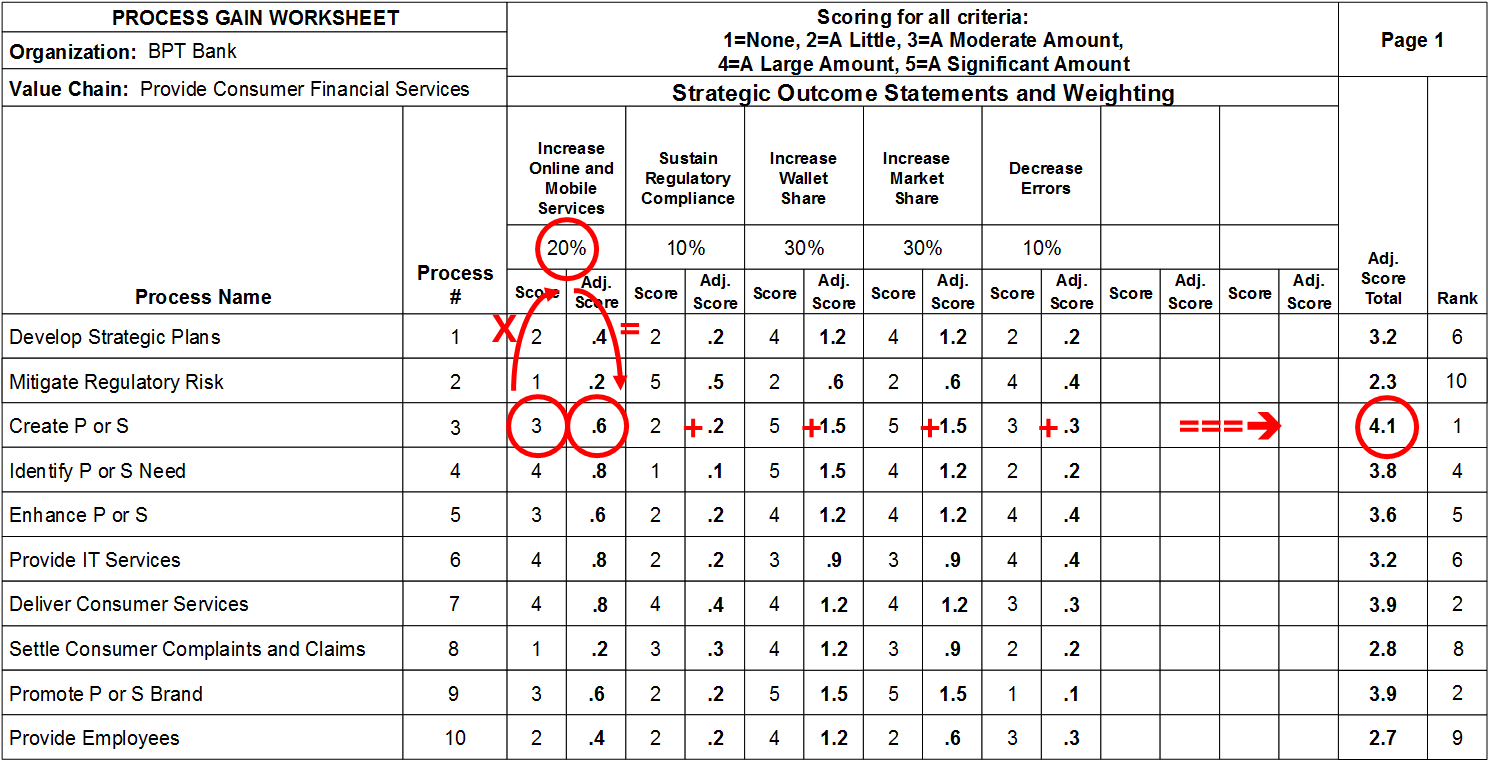
Comprehensive Gain
The approach shown in the previous article (9) shows a rough cut at the prioritization which may serve well at the beginning of architectural maturity. It can also be used to filter the set of processes to be further assessed – almost a first step. A more comprehensive approach can be taken that compares the processes point by point against the criteria of the North Star and performance gap factors.
In this approach, Gain calculations are made process by process against each separate point on the North Star and factored by their weighting contribution. The Gain calculations are assessed according to a scale from 1 to 5 with each number having the following increasing contribution.
1 = No contribution
2 = A Little
3 = A moderate amount
4 = A large amount
5 = A significant amount
Of course you will have to define what these values mean and work through a few examples before applying them to the set of processes that you are tackling. We must all be on the same page as to what ‘moderate’ really means.
After application of the gain criteria, each process will be summed by the weighted contribution for the total set of contributions for all North Star points. This is illustrated as shown for a particular process ‘Create Product or Service’. In this case it is agreed that the chosen process contributes ‘A Moderate Amount’ to the North Star aim of ‘Increase Online and Mobile Services’ which is a score of 3. When multiplying the 3 by the weighting factor or 20% its value is .6. Doing the same for each North Star statement, we will end up with a net score of 4.1. When we compare this to the other processes evaluated we discover that this process ranks first in Gain contribution and we would map it appropriately on the Pain/Gain Grid horizontal axis along with all the others.
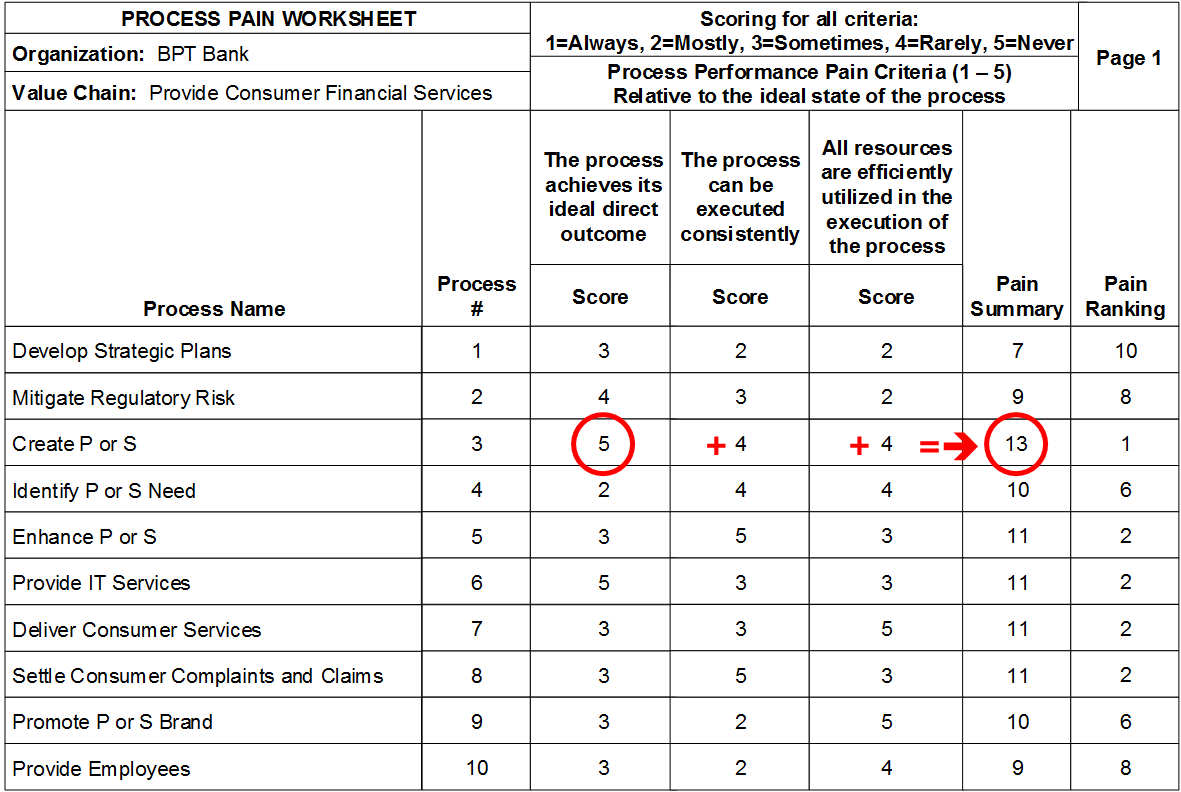
Comprehensive Pain
As with the Gain formalization, the Pain can be calculated using the factors indicated for lack of performance. Once more we will have to define what the scoring amounts really mean gaining a common understanding of the difference between ‘Sometimes’ and ‘Rarely’ for example.
1 = Always
2 = Mostly
3 = Sometimes
4 = Rarely
5 = Never
This is illustrated as shown for ‘Create Product or Service’. In this case it is agreed that the chosen process ‘Never’ achieves its ideal direct outcome which is a score of 5. Doing the same for each Pain criterion we will end up with a net score of 13. When we compare this to the other processes evaluated we discover that this process ranks first in Pain and we would map it appropriately on the Pain/Gain Grid vertical axis along with all the others.
Picking the priorities
Combining the results of the Pain and Gain calculations will enable us to define a set of processes that can now be investigated as the beginning of a business driven portfolio of change. The ones deserving more investigation will be to the top right since they will drive the greatest value creation for the market 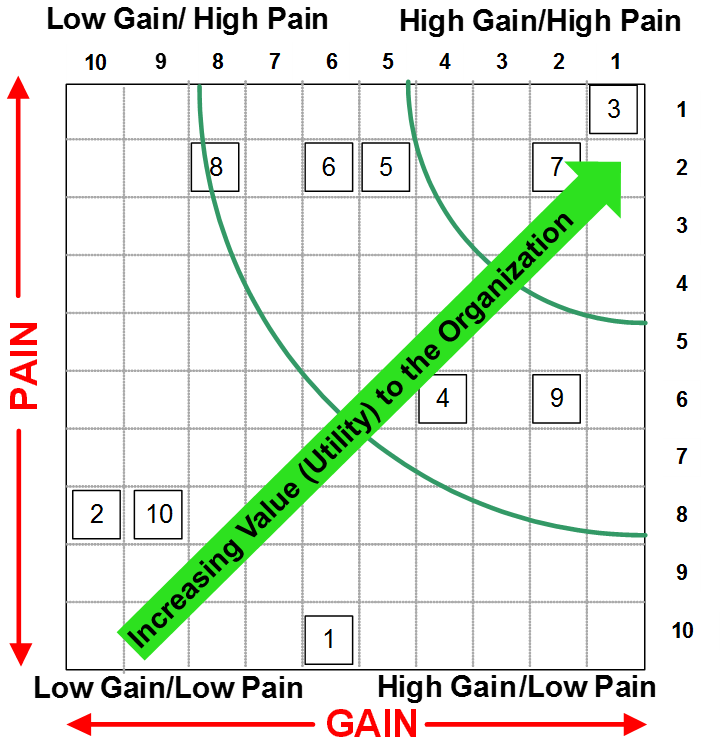
and the company alike. The organization cannot take on everything that’s broken so picking the most value added makes sense. This one page grid is of immense value to executives and those responsible for allocating funds. It is concise and elegant but it is not the end. We still have to determine dependencies, scope, the set of capabilities needed to be changed, the specific resources that have to be renewed and the feasibility of the changes not to mention the business case for the change effort.
Article 11 will look at how the priorities developed in this article will be developed into a clear scoping for change projects and a detailed plan for capability development and implementation and a roadmap for transformation.


